Background
I am fitting learning curves for cochlear implant (CI) users. These folks get a CI, and then need to start learning to understand speech again. They keep on improving for years. Along the way, speech recognition is tested frequently. The outcome measure of speech tests is a simple word or phoneme correct score. The %correct score runs from a minimum of 0%, to a maximum of... wait.for.it... 100%. No rocket science thus far.
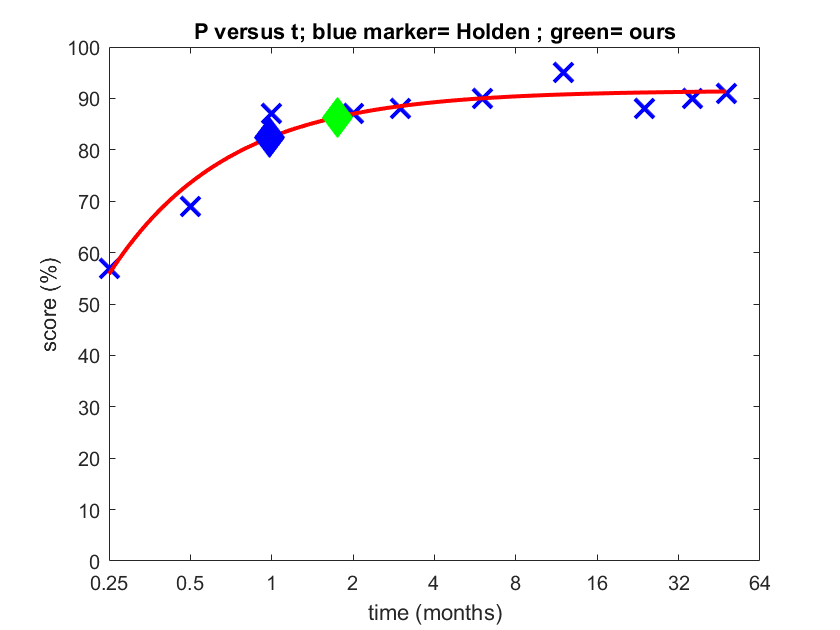
Typically, these learning curves start at a value around 25% and end at 80% (barred the rock stars, CI users never reach 100%). In the beginning they learn quick, and this levels off as to what seems a maximum (Fig. 1).
Question premise
Now I seek to fit a function to these data, because I want to know how fast they learn. I did this using regression analysis using the least-squares method in MATLAB. The function I used I found in another software package called GraphPad Prism. While the latter package was not used to analyze the data, I did use it as an inspiration to find a proper model. The function I fitted through the data (red line in Fig. 1) GraphPad calls a 'one-phase association function'
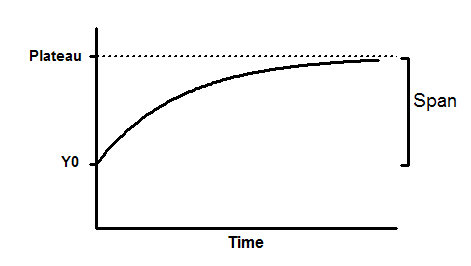
Y = Y0 + (Plateau-Y0).(1-exp(-Kx)), which translates to Y = Y0 + (Plateau-Y0).(1-e(-Kx)) if I am not mistaken (I don't understand the fancy formula make up, hope this'll do...) (Fig. 2). The link explains the backgrounds, but in a nut shell, it is based on a biochemical process, namely the interaction between an enzyme and a substrate. My purpose is a totally different one, namely a psychophysical one to model a learning process.
I chose the 'one-phase association' function, because the main parameters in the model follow my needs very well: it has a start value Y0 that reflects the baseline score when people get their CI, and there is a maximum (Plateau). In addition, it has the K value, which in (psycho-)physics would be called tau, which describes the slope. And this slope is what we need, as we want to know how fast these people learn.
Specific questions
- Is the 'one-phase association' a proper way to fit a learning curve? It is a function I only know from Biochemistry;
- A colleague over in the USA used a 'logit' function for this purpose. Afaik, a logit function does not have a slope parameter and hence, from my pov, it would be less fitting for my purposes (pun not intended). Is a logit function the best way to fit a learning curve?

Fig. 1. Learning curve obtained in quiet at 65 dB speech level. Blue crosses: raw experimental data. Red line: fitted logarithmic function. Diamonds: derived fitting features irrelevant to the question proper. source: own work

Fig. 2. One-phase association Y=Y0 + (Plateau-Y0)(1-exp(-Kx)). source: GraphPad