7
$\begingroup$

Background
I am fitting learning curves for cochlear implant (CI) users. These folks get a CI, and then need to start learning to understand speech again. They keep on improving for years. Along the way, speech recognition is tested frequently. The outcome measure of speech tests is a simple word or phoneme correct score. The %correct score runs from a minimum of 0%, to a maximum of 100%. No rocket science thus far.

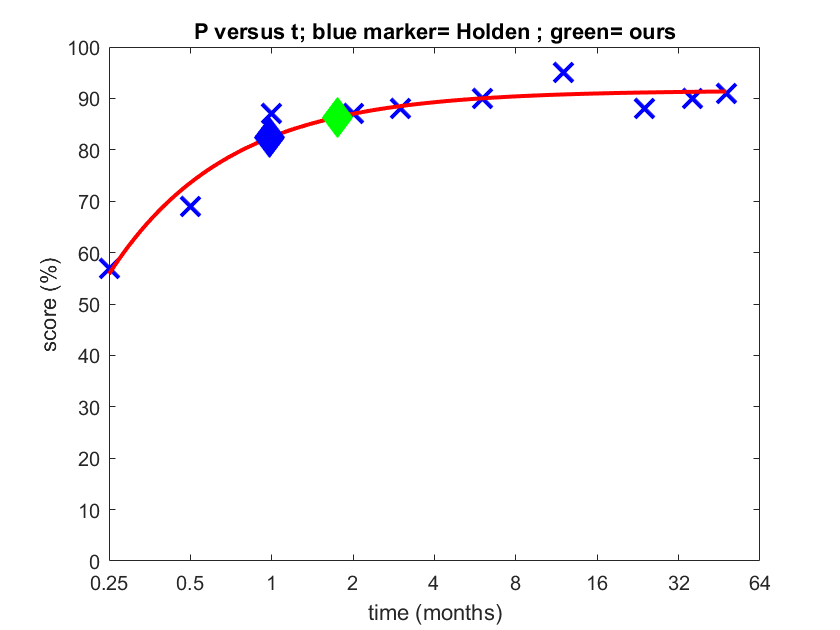
Typically, these learning curves start at a value around 25% and end at 80% (barred the rock stars, CI users never reach 100%). In the beginning they learn quick, and this levels off as to what seems a maximum (Fig. 1).

Question premise
Now I seek to fit a function to these data, because I want to know how fast they learn. I did this using regression analysis using the least-squares method in MATLAB. The function I used I found in another software package called GraphPad Prism. While the latter package was not used to analyze the data, I did use it as an inspiration to find a proper model. The function I fitted through the data (red line in Fig. 1) GraphPad calls a 'one-phase association function'

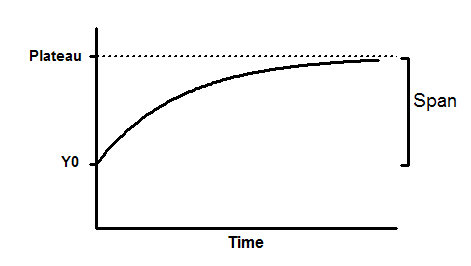
Y = Y0 + (Plateau-Y0).(1-exp(-Kx)), which translates to Y = Y0 + (Plateau-Y0).(1-e(-Kx)) if I am not mistaken (I don't understand the fancy formula make up, hope this'll do...) (Fig. 2). The link explains the backgrounds, but in a nut shell, it is based on a biochemical process, namely the interaction between an enzyme and a substrate. My purpose is a totally different one, namely a psychophysical one to model a learning process.

I chose the 'one-phase association' function, because the main parameters in the model follow my needs very well: it has a start value Y0 that reflects the baseline score when people get their CI, and there is a maximum (Plateau). In addition, it has the K value, which in (psycho-)physics would be called tau, which describes the slope. And this slope is what we need, as we want to know how fast these people learn.

Specific questions

  1. Is the 'one-phase association' a proper way to fit a learning curve? It is a function I only know from Biochemistry;
  2. A colleague over in the USA used a 'logit' function for this purpose. Afaik, a logit function does not have a slope parameter and hence, from my pov, it would be less fitting for my purposes (pun not intended). Is a logit function the best way to fit a learning curve?*

* EDIT: after a literature search I found that the logit function is a sigmoid function, and, hence, it does have a slope parameter
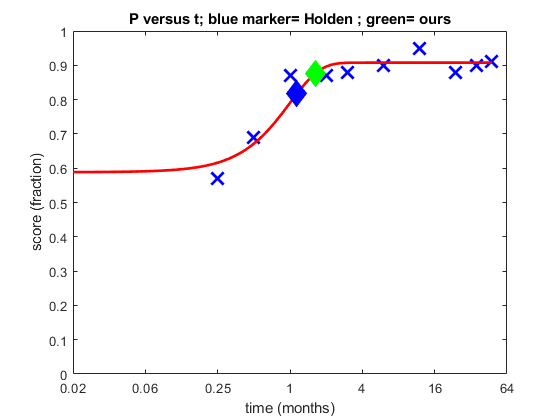
matlab learning in quiet s#2 65 dB
Fig. 1. Learning curve obtained in quiet at 65 dB speech level. Blue crosses: raw experimental data. Red line: fitted logarithmic function. Diamonds: derived fitting features irrelevant to the question proper. source: own work
'One-phase association' curve: Y=Y0 + (Plateau-Y0)(1-exp(-Kx))
Fig. 2. One-phase association Y=Y0 + (Plateau-Y0)(1-exp(-Kx)). source: GraphPad
$\endgroup$
0

6 Answers 6

3
+100
$\begingroup$

Sigmoids are more general and probably better for modeling learning than a simple exponential. Your exponential fits decently, but it probably doesn't describe the actual underlying process very well.

Importantly, learning is often not fastest at the start, there is often some level of "aha!" moment later on. Sigmoids can capture this.

There are a variety of sigmoidal functions, but they are all differentiable and have a central peak in the first derivative. The time to peak and slope at peak are both parameters you can use to measure learning rate, though they measure somewhat different things. Which one is more applicable will depend on how learning in your paradigm varies across subjects and conditions. Looking at the data you posted, the peak slope (peak of the first derivative) is probably a decent choice, although I'm not sure you really have enough data points in the first month to get a good measure.

Exponential fits are likely to be more unstable, and in the data you've posted it looks like your fit is overfitting the beginning and end of the learning process, so you're missing the most important part for determining the actual "speed", which is between your first 3 data points; none of these are fit well. With an exponential fit, you are supposing that the most learning occurs at the point of the first trial. In most tasks without substantial prior instruction, you need at least a couple of trials to even figure out what is going on, and can't start to improve until then. If that first "trial" is a whole block then maybe this is not a terrible assumption, but that's mainly because you've already passed the peak slope of the sigmoidal function early on; if you used the entire data then a sigmoid would still fit better.

See also https://en.wikipedia.org/wiki/Learning_curve and:

Culler, E., & Girden, E. (1951). The learning curve in relation to other psychometric functions. The American journal of psychology, 64(3), 327-349.

Gallistel, C. R., Fairhurst, S., & Balsam, P. (2004). The learning curve: implications of a quantitative analysis. Proceedings of the National Academy of Sciences, 101(36), 13124-13131.

Daller, M., Turlik, J., & Weir, I. (2013). Vocabulary acquisition and the learning curve. Vocabulary Knowledge: Human ratings and automated measures, 47, 185.

$\endgroup$
9
  • 1
    $\begingroup$ @AliceD Have you tried modelling more directly the responses? Rather than summarized at a weekly level? Also, to me, your data look very sigmoidal. Yes, the initial phase is blocked a bit and the ramp up starts early, but sigmoids can handle that; exponentials cannot. $\endgroup$
    – Bryan Krause
    Commented Jun 18, 2020 at 18:05
  • 1
    $\begingroup$ @AliceD Pssht, I'd be embarrassed if I hadn't managed to poke my fingers someplace in the general realm of neurosciences :-D ephys, fMRI, public health, gene microarrays, psychedelics as pharmaceuticals... but yes I've done a bit of psychophysics analysis and a whole lot of curve fitting more generally; most of my expertise in that particular area is in modeling neurometric vs psychometric response functions, though, and wanders back to my undergrad days. Feel free to ping me if you want to talk outside of SE norms, I'm always interested in (if not hypercritical of, so beware) data. :) $\endgroup$
    – Bryan Krause
    Commented Jun 18, 2020 at 21:01
  • 1
    $\begingroup$ I should say though that the references I threw in this answer were just from a cursory search, they aren't ones I hold in particular regard or anything. I'm familiar with similar experiments, though, some undergrads in the lab when I first started grad school were doing some learning experiments with rodents and frequency discrimination. $\endgroup$
    – Bryan Krause
    Commented Jun 18, 2020 at 21:03
  • 1
    $\begingroup$ @baca There's no reason a sigmoid can't start at chance (that's just an offset), and there is definitely a flat asymptote at both ends for sigmoidal functions. Check the references I've included, as well, which explain why sigmoidal functions are good for following learning. I agree with you, though, that theory is not always necessary, and since a sigmoid follows an exponential (decay) shape past the midpoint, yes, if you reach that point quickly you might get a decent fit with an exponential. $\endgroup$
    – Bryan Krause
    Commented Jun 19, 2020 at 22:32
  • 1
    $\begingroup$ @baca I would not, however, recommend using goodness of fit tests to choose a model when you have theoretical reason to use another option. You're likely to overfit, especially in cases where you don't have extra data to burn using cross-validation. $\endgroup$
    – Bryan Krause
    Commented Jun 19, 2020 at 22:35
1
$\begingroup$

This equation $Y_0 + (Y_{max}-Y_0)\left[1-e^{-\kappa x}\right]$ is simply an exponential approach, that is the solution to a first order differential equation. It is the most widespread equation in physics describing a process where the rate of change of a system is related to the state of the process. In the context of learning, it tells you that the better you are, the slower you keep improving. For that reason it is considered, as far as I know, the principled way to model learning.

As you figured out $Y_0$ is your starting point, $Y_{max}$ your asymptote, $\kappa$ the rate of change and $x$ your variable, usually time $t$. You'll often rather see this equation as $e^{-\frac{t}{\tau}}$, where $\tau$ is called the time constant and has the same unit as $t$ (obviously $\tau=\frac{1}{\kappa}$ and doesn't change anything about the meaning of the equation). It tells you, in the context of a resistor-capacitor circuit for example, the time it takes for the capacitor to discharge its energy through the resistor (in facts only about 1 third its energy, and is considered fully discharged after $3\tau$ because it has less than 5% its original energy remaining). So for learning this parameter has a clear meaning as well (learning time), and you can interpret it the same way people do in physics.

A logit function has a slope value as well. It is the natural way to model anything related to odd-ratios but I would argue it is not meaningful in the context of learning. If all you want is a descriptive model to compare the speed of learning it doesn't really matter what model you use as long as it fits data well. But I don't see the point of using a less principled and more complicated model when a simple exponential works.

A last point is that you could use a binomial distribution and Maximum likelihood estimation to fit your curve, instead of mean squares. It's just slightly nicer mathematically as mean squares kind of assumes that you could have a ratio correct >100%. But that's just a detail, both techniques will give you good results.

$\endgroup$
0
1
$\begingroup$

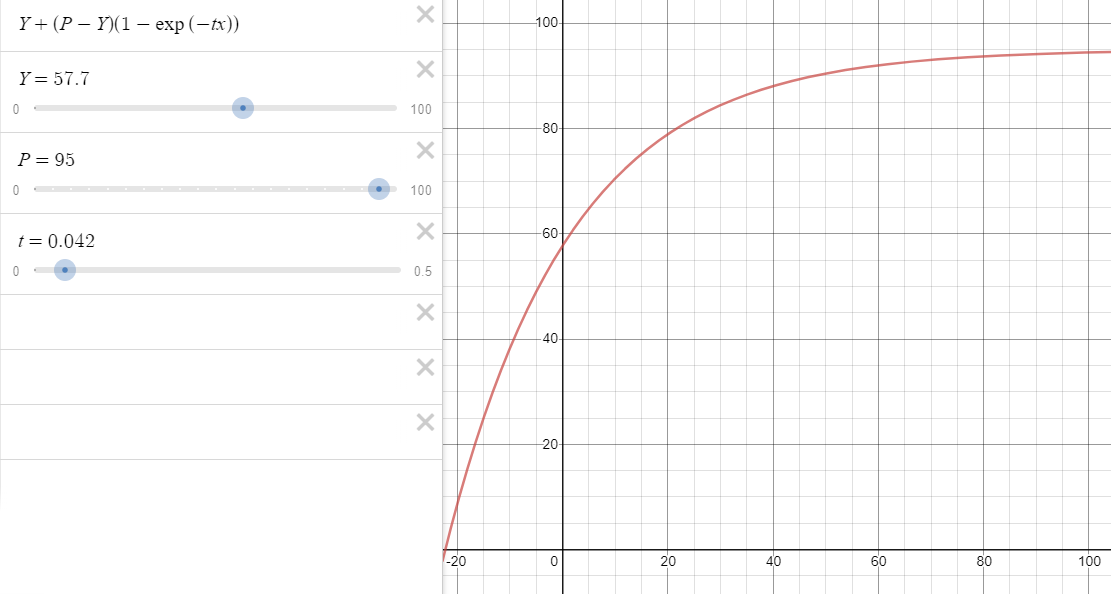
You could use something like Desmos to rapidly try out different functions and see how well they fit the different datasets you have.

The site allows you to vary different function parameters using sliders and see how the shape changes in response.

For example, here's a plot using Demos that reproduces the shape of the curve used to fit the data in Fig 1 quite well.

enter image description here

The above plot and sliders can be seen here: https://www.desmos.com/calculator/w0ye3ynpia

You can imagine the various curve fitting packages as essentially varying the parameter sliders to find the curve with minimum deviation from the data points.

$\endgroup$
1
$\begingroup$

Short answer
Learning curves can be fitted well with standard psychometric curves, like the Weibull function.

Background
I decided to also post an answer here myself, as I've been working on the data after the answers came in. I accepted Bryan's answer as they rightfully suggested that these data should not be fitted with a simple exponential, but with a psychomteric (sigmoid) curve. I chose the Weibull and went on from there.

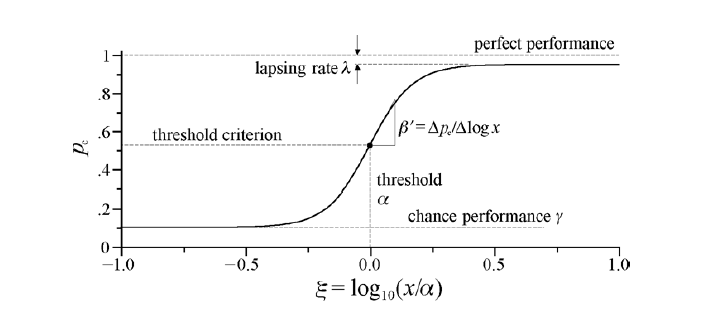
A general form of the psychometric curve has two horizontal asymptotes, corresponding to minimum (guess rate) and maximal performance (1-lapse rate). They are often denoted as gamma and lambda, respectively (eq. 1).

general psychometric curve
Eq. 1. General psychometric curve (Strasburger, 2001)

A generalized psychometric curve is shown in Fig. 1. psychometric_curve Fig. 1. Psychometric curve (Strasburger, 2001)

The Weibull function is a popular used sigmoid for psychometric fitting purposes. Its function is shown in eq. 2. Note that gamma, or lapse rate, is omitted here, but can be simply added back in the first factor.

Weibull
Eq. 2. Weibull. Note that lapse rate lambda has been omitted (Strasburger, 2001)

The Weibull function has been used before for learning curves, as shown by the paper cited by Bryan above (Gallistel et al., 2004). The logit function in the question is a variant on the Weibull.

Now, the speed of learning (beta') can be elegantly estimated by the maximum of the first derivative, as pointed out by Bryan in the accepted answer, i.e., the point where the second derivative equals zero, according to

slope estimate
Eq. 3. maximal slope of the Weibull function. Note that lapse rate lambda has been omitted (Strasburger, 2001)

In my specific case, I had to use a derived version because of the 2log axis in my data as pointed out above in the question.

I recommend the Strasburger (2001) paper for further details.

For comparison, I plotted the same sample data as above in the question using a Weibull fit in Fig. 2. The fit is still not great, as it has difficulty finding the lower aymptote, because of the lack of data here. This was the reason I chose the simple exponential earlier, as I was worried about this. Note that I expanded the left-hand side of the x-axis here to better show the course of the lower asymptote.

sample data
Fig. 2. Sample data with Weibull fit using the same data as in the question. source: own work

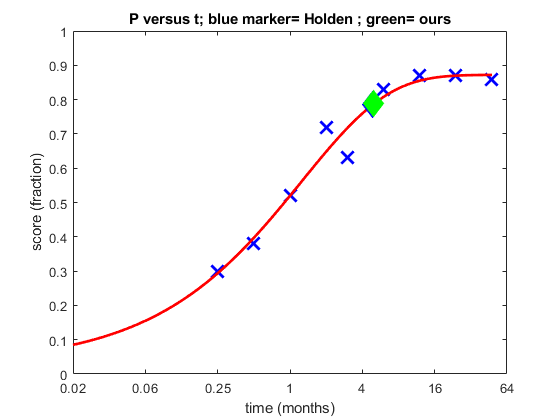
A more convincing fit is shown in Fig. 3, where the data is quite obviously a sigmoid. For this reason, a weibull fit is better. Further, (Gallistel et al., 2004) also successfully fitted data that lacked data points around the lower asymptote (their Figs. 1 & 7).

sample sigmoid data
Fig. 3. Sample data with Weibul fit using other data than in the question. source: own work

References
- Gallistel et al., PNAS (2004); 101(36): 13124-31
- Strasburger, Percept Psychophys (2001); 63(8), 1348-55

$\endgroup$
6
  • $\begingroup$ Excellent answer, you've gone into some of the particularities of the relevant functions that I know were discussed in some of the references I gave but that I didn't take the time to explain out well, as you have done here. I'm curious, are you fitting these curves to all of the data or only the blue Xs (I'm assuming the diamonds are distinct in some way)? $\endgroup$
    – Bryan Krause
    Commented Jun 25, 2020 at 14:42
  • $\begingroup$ Hi @BryanKrause thanks for the credits. The diamonds are some outcome measures that I should've left out of the graphs -- I was being a tad lazy I'm afraid.... It's just the blue Xs indeed that were fitted. $\endgroup$
    – AliceD
    Commented Jun 25, 2020 at 14:59
  • 1
    $\begingroup$ Gotcha; I was hoping you'd say they're included so I could wonder if fitting to just the Xs would have improved your first fit, guess not! :) Second one looks quite pretty, though. $\endgroup$
    – Bryan Krause
    Commented Jun 25, 2020 at 15:26
  • $\begingroup$ Yeah, the second one is the 'typical example' we'll show in the paper ;-) But you said the simple exponential overfitted the data, I reckon the Weibull also overfits it. It's just not great data I guess. It happens in around half of the cases, perhaps less. $\endgroup$
    – AliceD
    Commented Jun 26, 2020 at 7:08
  • 1
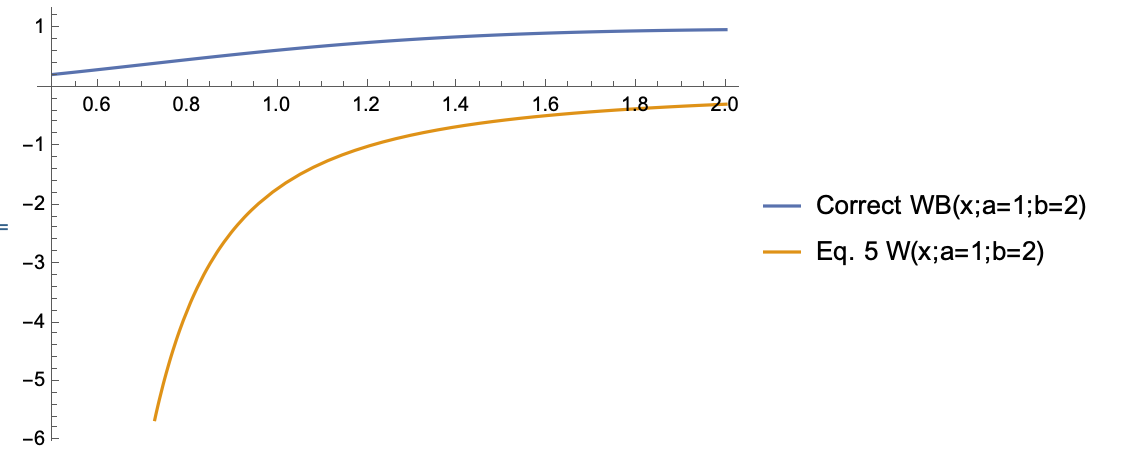
    $\begingroup$ Eq.2 from Strasburger 2001 is wrong, it should read 1-exp(-(x/L)^S) not 1-exp( (x/L)^-S ). The latter, diverges to minus infinity for small values of x/L. $\endgroup$ Commented Mar 20, 2023 at 20:09
1
$\begingroup$

The Weibull function is a much used psychometric curve, and has also appeared in the literature to model learning curves (Horsfall et al., 2022). The graphed Weibull function in the quoted Strassburger 2001 paper looks correct. However, Eq. 2 mentioned by AliceD above from that same paper (Eq. 5 in Strassburger's 2001 paper) seems to have the minus at the wrong position. This was likely just a typo, yet a typo of the serious kind because it changes the character of the function fundamentally. Strassburger's starting equation, 1 - exp(-exp(log(x/a)*b)), (Eq. 2) is correct and can be simplified to
1 - exp(-(x/a)^b) while he had 1 - exp((x/a)^(-b)) (Eq. 5).

Eq. 5 yields negative values throughout and diverges as x-> 0

Anyway, thanks a lot for calling my attention to the paper by Strassburger, it provides a useful summary.

References
- Horsfall et al., Front Surg (2022); 9
- Strasburger, Percept Psychophys (2001); 63(8), 1348-55

$\endgroup$
1
  • $\begingroup$ Thanks for the enlightening answer! I was just struggling with this equation when your answer came in. Much appreciated. I edited the text somewhat to make it appear as a full answer, instead of just a comment. $\endgroup$
    – AliceD
    Commented Mar 23, 2023 at 8:08
0
$\begingroup$

Is your objective to model:

  • the decline in incremental daily learning over time, or
  • the total cumulative learning,

My feeling is that this problem is better modelled by thinking of the problem as modelling the decline in incremental daily learning over time.

There are two reasons for my assertion:

  1. The decline in daily learning accords more with reality, and
  2. there are far more distributions to model deline, such as: exponential, Weibull, log-normal, gamma.

My gut feel tells me that modelling the incremental with a log-normal would be a great starting point.

Said another way, I think you should be modelling the probability density function (pdf) rather than the cumulative density function (cdf). In statistics, we start by modelling the pdf. The cdf is an outcome.

$\endgroup$
1
  • $\begingroup$ Thanks for your answer. It's the cumulative learning I wish to fit, the rate of learning can then be deduced by, I guess, differentiation as Bryan Kraus suggests. However, I have to dive deeper into that (or you might have the answer to that :-). It's really a psychophysics problem. $\endgroup$
    – AliceD
    Commented Jun 19, 2020 at 10:09

Your Answer

By clicking “Post Your Answer”, you agree to our terms of service and acknowledge you have read our privacy policy.

Not the answer you're looking for? Browse other questions tagged or ask your own question.