9
$\begingroup$

I came across this research article "Case Study of Ecstatic Meditation: fMRI and EEG Evidence of Self-Stimulating a Reward System" about the brainwaves when a Yogi went into a meditative level.

I know that we have 5 types of brainwaves:

  • Gamma 40Hz~
  • Beta 14-40Hz
  • Alpha 7.5-14Hz
  • Theta 4-7.5Hz
  • Delta 0.5-4Hz

As for Meditative Stages, we have 8 stages:

Material

  • Jhana 1
  • Jhana 2
  • Jhana 3
  • Jhana 4

Immaterial

  • Jhana 5 / Arupa Jhana 1
  • Jhana 6 / Arupa Jhana 2
  • Jhana 7 / Arupa Jhana 3
  • Jhana 8 / Arupa Jhana 4

enter image description here

enter image description here

enter image description here

enter image description here

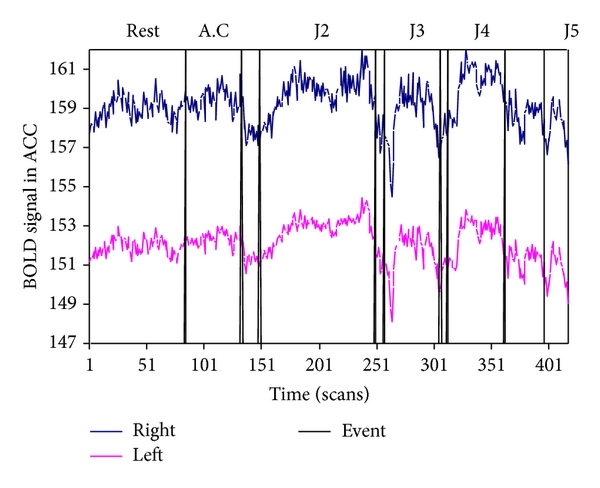
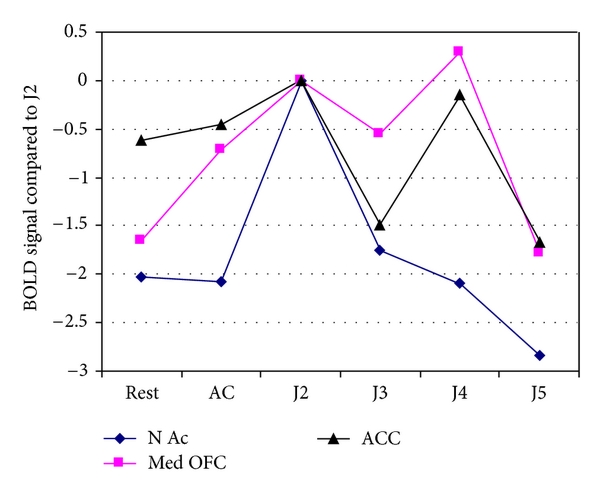
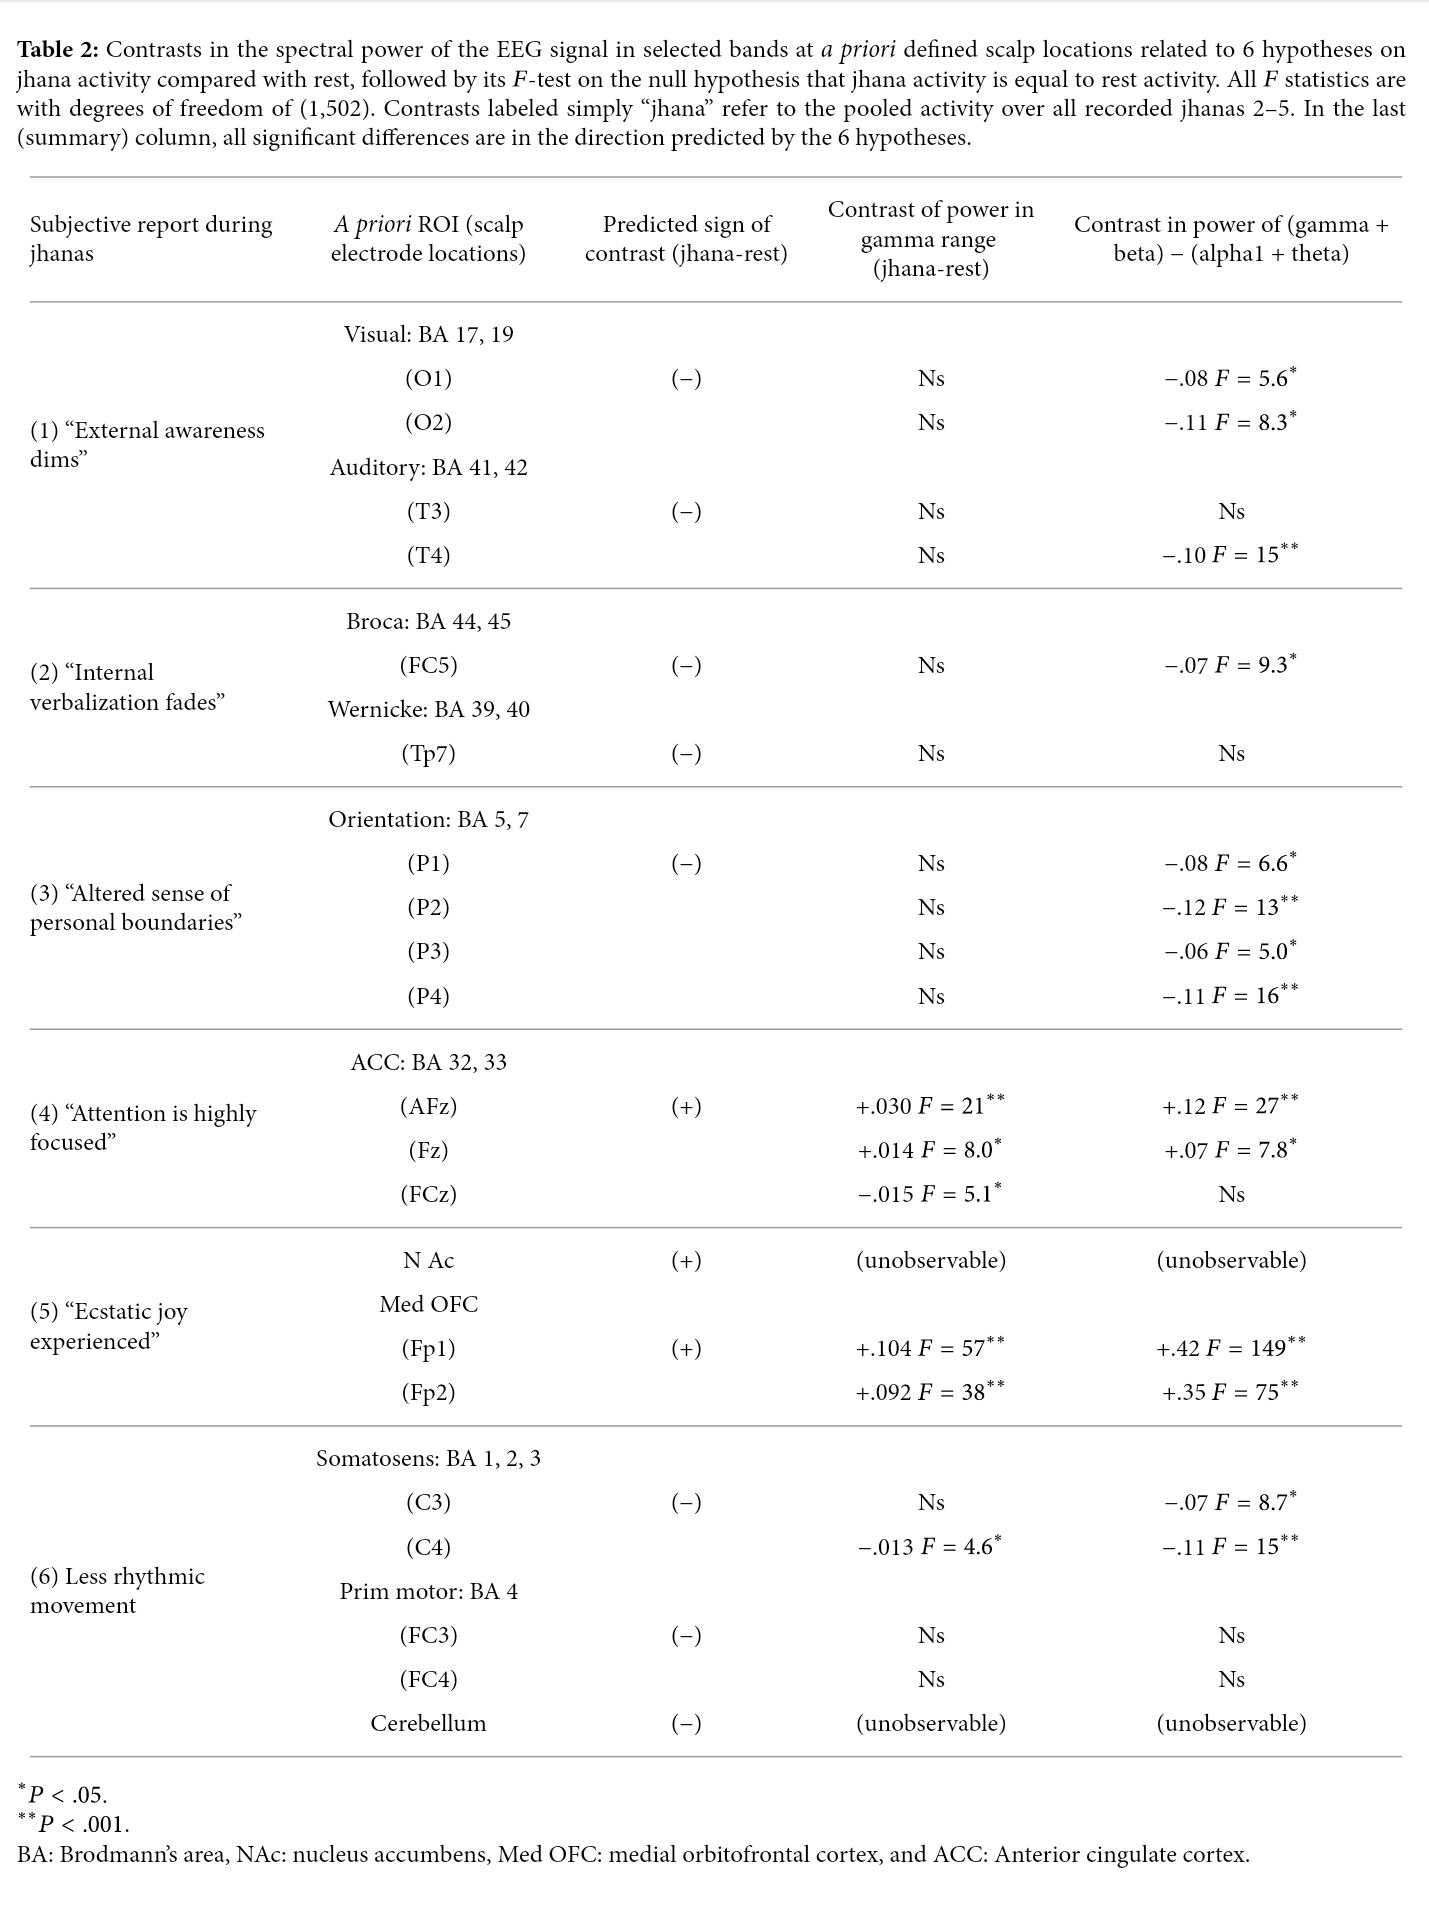
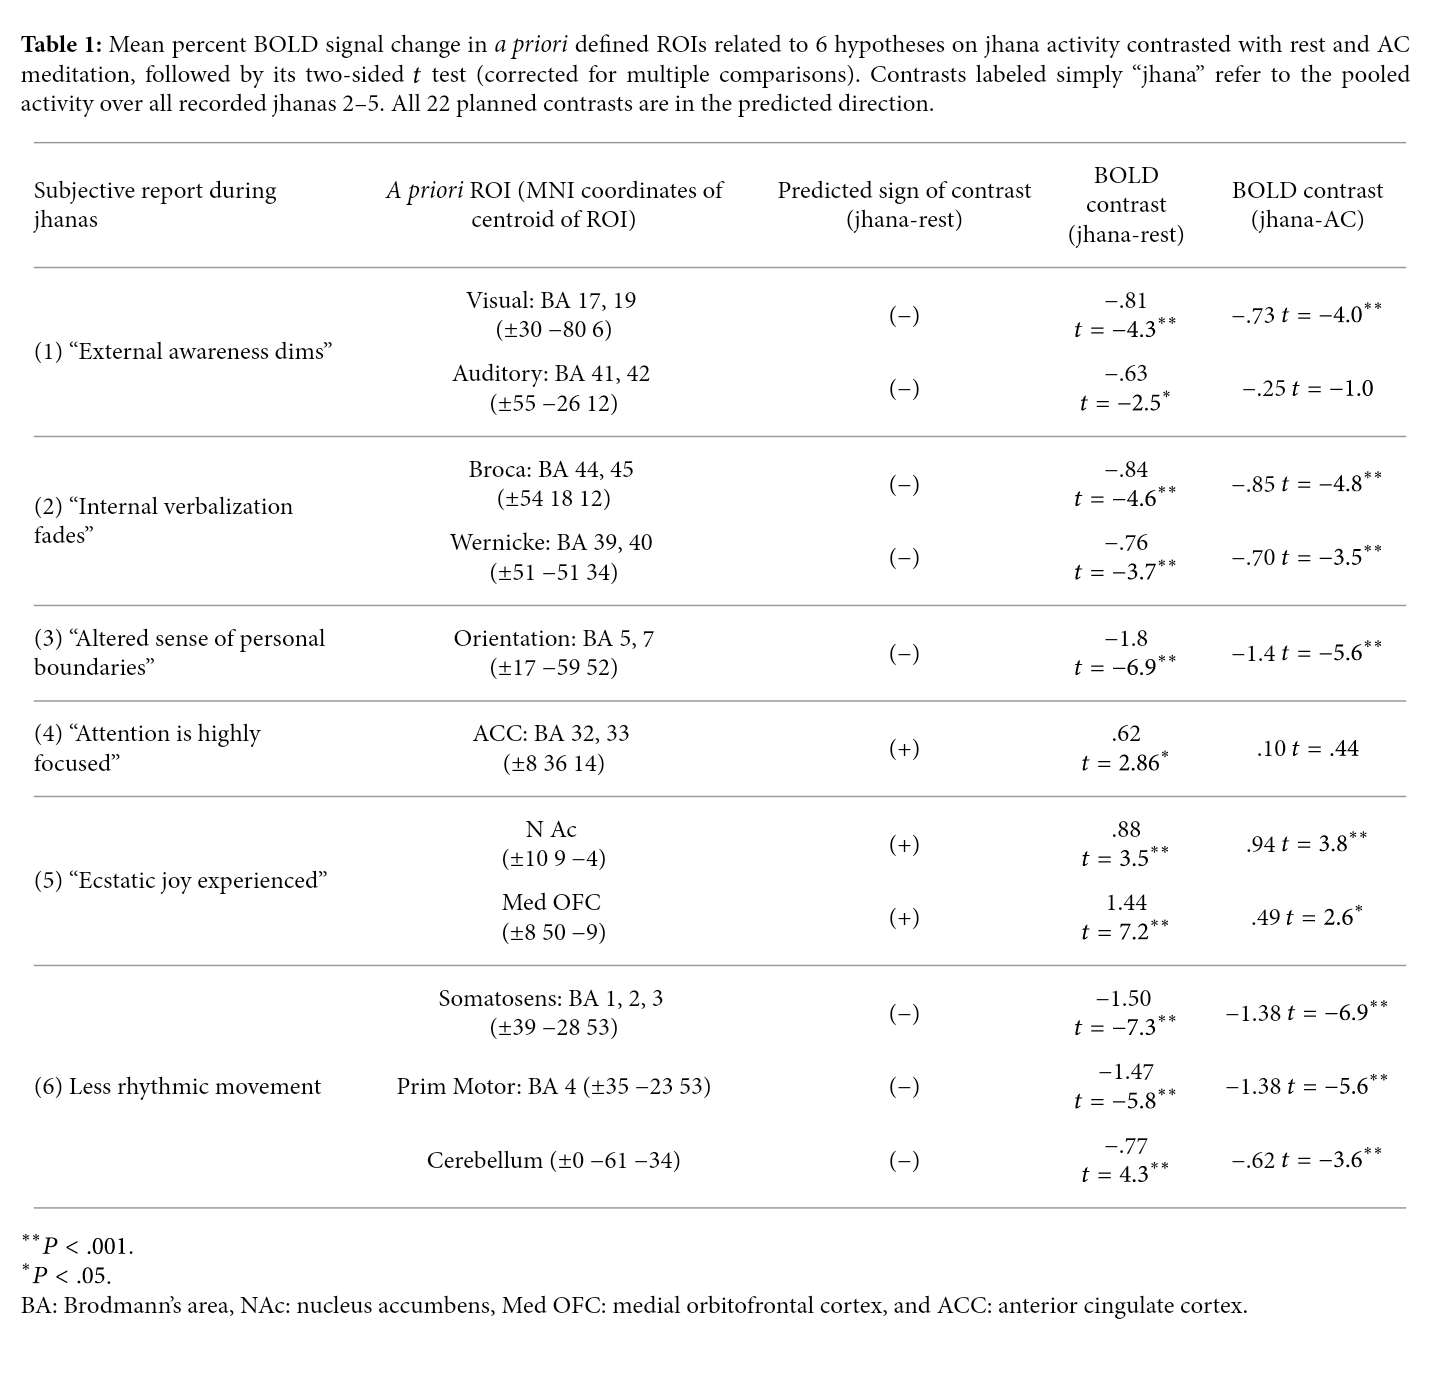
As for what I've read on the paper, they could only start from Jhana 2 as "Jhana 1 was not practiced because the associated head movements would induce excessive artifact". Until Jhana 5 as there is some problem with Jhana 6-8 because the "fMRI recording then ended due to scanner memory limitations (421 volume maximum)".

How can I transform each meditative states [time-series data] into brainwaves frequencies?

$\endgroup$
2
  • $\begingroup$ Try to specify a little more the question or the reasons for it, very interesting article and I hope to see more content about meditation on the site. $\endgroup$ Commented Jun 8, 2017 at 15:23
  • $\begingroup$ Actually i don't know how to read the diagrams. I want to know what's the frequency for each jhana. Well maybe alpha1 for jhana 2 alpha2 for jhana 3 and theta for jhana 4 $\endgroup$
    – LomX
    Commented Jun 9, 2017 at 14:04

1 Answer 1

1
$\begingroup$

Thank you for your interesting question!

Generally, there are three types of methods to process your EEG time-series data:

  • Time domain methods (e.g., regression, statistical analysis on your EEG time-series data, etc.)

  • Frequency domain methods (e.g., Fourier Transform)

  • Time-frequency domain methods (e.g., Short-Time Fourier Transform, Wavelet Transform, Gabor Transform, etc.) Wikipedia

You may use time-frequency methods to categorize or classify those states, if you will. It is very simple. Time-frequency methods transform your [1-D] time-series EEG data into a new [2-D] domain that you can see both time and frequency information.

[1-D] Frequency domain methods only return frequency information of your [1-D] EEG time signals, which means that your [1-D] time data will be lost in exchange for having [1-D] frequency data.

[1-D] Time domain methods only return [1-D] time analysis of your EEG signals, which also cannot help you to capture the frequency information.

May I suggest you to use Continuous Wavelet Transform or Discrete Wavelet Transform to do this job?

There are many tools/languages that might help you to do so: MatLab, Python, and such. If you might have a programmer around you, s/he can probably help you in a few hours or a day to pass your [1-D] EEG time data through one of these [2-D] time-frequency methods and visualize the outputs.

$\endgroup$

Your Answer

By clicking “Post Your Answer”, you agree to our terms of service and acknowledge you have read our privacy policy.

Not the answer you're looking for? Browse other questions tagged or ask your own question.