6
$\begingroup$

I am designing a psychology study in which the main endpoint is the perceived effectiveness of various medical treatments. In pilot trials, we used a bipolar Likert scale to measure perceived effectiveness:

  • Very ineffective
  • Ineffective
  • Somewhat ineffective
  • Somewhat effective
  • Effective
  • Very effective

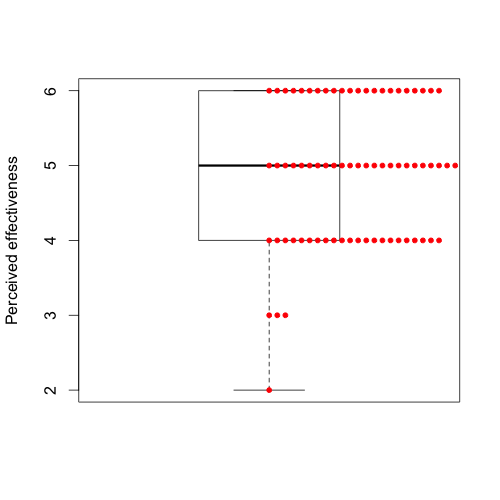
Unfortunately, pilot data indicate a major ceiling effect. Combining two similar pilot trials (n=73), only four responses had perceived effectiveness below "Somewhat effective": enter image description here

(I'm overlaying a dotplot on a standard boxplot here.)

Are other psychometric scales better suited to separating the clustered responses at the high end of the scale? Does adding more items to the Likert scale (say, increasing to 8 options) improve matters without sacrificing too much reliability? References especially appreciated where possible.

$\endgroup$
3
  • $\begingroup$ I get the feeling that when you talk about a scale, you refer to the scoring format (1-6), and that you have only one item. Is that correct? $\endgroup$ Commented Oct 12, 2013 at 21:56
  • $\begingroup$ @Jens, sorry, not quite sure I understand the question. Internally, I code the six values of the Likert scale as 1-6, with 1 corresponding to "Very ineffective," 2 corresponding to "Ineffective," etc. I have a few different items (questions), each requiring an estimate of effectiveness on the above Likert scale. Does that answer your question? $\endgroup$
    – half-pass
    Commented Oct 13, 2013 at 0:43
  • 1
    $\begingroup$ @half-pass I think Jens is just trying to clarify a few terms. Most commonly, one question is called a Likert item and a collection of them being averaged a Likert scale, whereas the value of a person for an item is called a score. $\endgroup$
    – ThomasH
    Commented Oct 18, 2013 at 6:37

1 Answer 1

5
$\begingroup$

Here are a few thoughts:

Work out whether the construct has ceiling effects or whether it is a measurement issue: You need to consider whether people actually discriminate between the rated objects.

Multiple items per rated object: For each medical treatment you could ask participants to answer several questions. You could then take the mean of their responses for the items to get an overall rating of each treatment for each participant. This increases the number of possible scores and should also increase the reliability of measurement.

Is the aim to measure the group property or an individual property: For example, if you are aiming to get a measure of the degree to which a group considers a treatment effective, then by averaging over many individuals you should get nuanced measure. So even if people are generally answering 4,5, and 6, one treatment will have more 4s and 5s and another might have more 5s and 6s. The result is that the mean of such ratings will still be nuanced measure, and you can then say things like one treatment having a mean of 4.5 and another having a mean of 5.5, and so on. So in that sense, you can still compare group-level opinions of effectiveness.

Forced choice or ranking format: You could adopt a forced choice or ranking format where participants are asked to rank or make some form of comparative assessment of the relative effectiveness of a set of treatments. This has pros and cons. It will obviously give you a good understanding of perceptions of relative effectiveness, but you will not have information on how effective they perceive the treatments relative to a general standard of effectiveness.

Change the response scale: There are many choices for response scales. You can add more scale points (e.g., go to 7 or 10 point scale). You could even design a scale that is not balanced, so you make more distinctions of effectiveness. Personally, I think you need a principle to govern your choice of scale. A good general rule is to talk to people doing the rating and find out what words they use to describe the effectiveness of treatments. How many distinctions do they make? What is the difference between ineffective and very ineffective in their mind?
$\endgroup$
1
  • $\begingroup$ Good suggestions; thanks. I'm a bit afraid of averaging Likert responses either to create a composite rating or in aggregate statistical analysis: is it really OK to treat Likert data as interval rather than ordinal? I see this practice a lot, but am not sure if there's been empirical justification. Regarding changing the response scale, are there any disadvantages to adding more scale points? Is there a "magic number" over which you start to lose reliability? $\endgroup$
    – half-pass
    Commented Oct 13, 2013 at 16:17

Your Answer

By clicking “Post Your Answer”, you agree to our terms of service and acknowledge you have read our privacy policy.

Not the answer you're looking for? Browse other questions tagged or ask your own question.