1
$\begingroup$

I'm working on some EEG data we collected using the Emotiv Epoc headset using 14 channel sensors.

I need to isolate chunks of data where all 14 channels are stable (non-noisy) for a given length of time (e.g. 5 seconds). I've written a MATLAB script for this, such that I calculate the standard deviation of each channel and pass an analysis window over the data, comparing the difference between maximum and minimum values in the window to this standard deviation (i.e. where maximum - minimum is less than the standard deviation [or 3-5 standard deviations], I treat that window as stable).

Based on this criteria, I am having some success in finding 5 second long segments but am worried this data may not be reliable (or not as stable/artefact free as desired).

Are there any better ways of performing this analysis? Even better, are there any functions built into EEGLAB for this very purpose?

Further info:

I've selected only the relevant channels and can now look through my EEG data files.

I am no neuroscience expert, actually I'm rather new to this sort of analysis, so apologies if this question is overly basic or off-point.

EDIT

We collected our data in a museum environment (very noisy in many ways), with participants sitting as still as possible for 2-minute sessions at a go. For this reason, there is a high likelihood of artefacts being found in the data due to movement, the environment and possibly even inaccuracies from the device itself (since we went through a rather large number of participants, cleaning and charging the headsets in between trials).

From what I've discussed with the team, I've been told that removing artefacts wouldn't solve the issue (though admittedly I'm no expert as to why this would be).

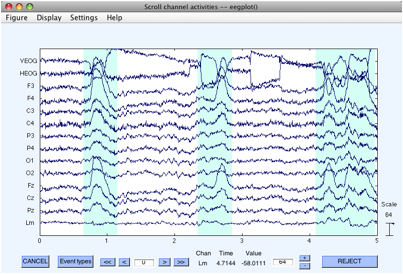
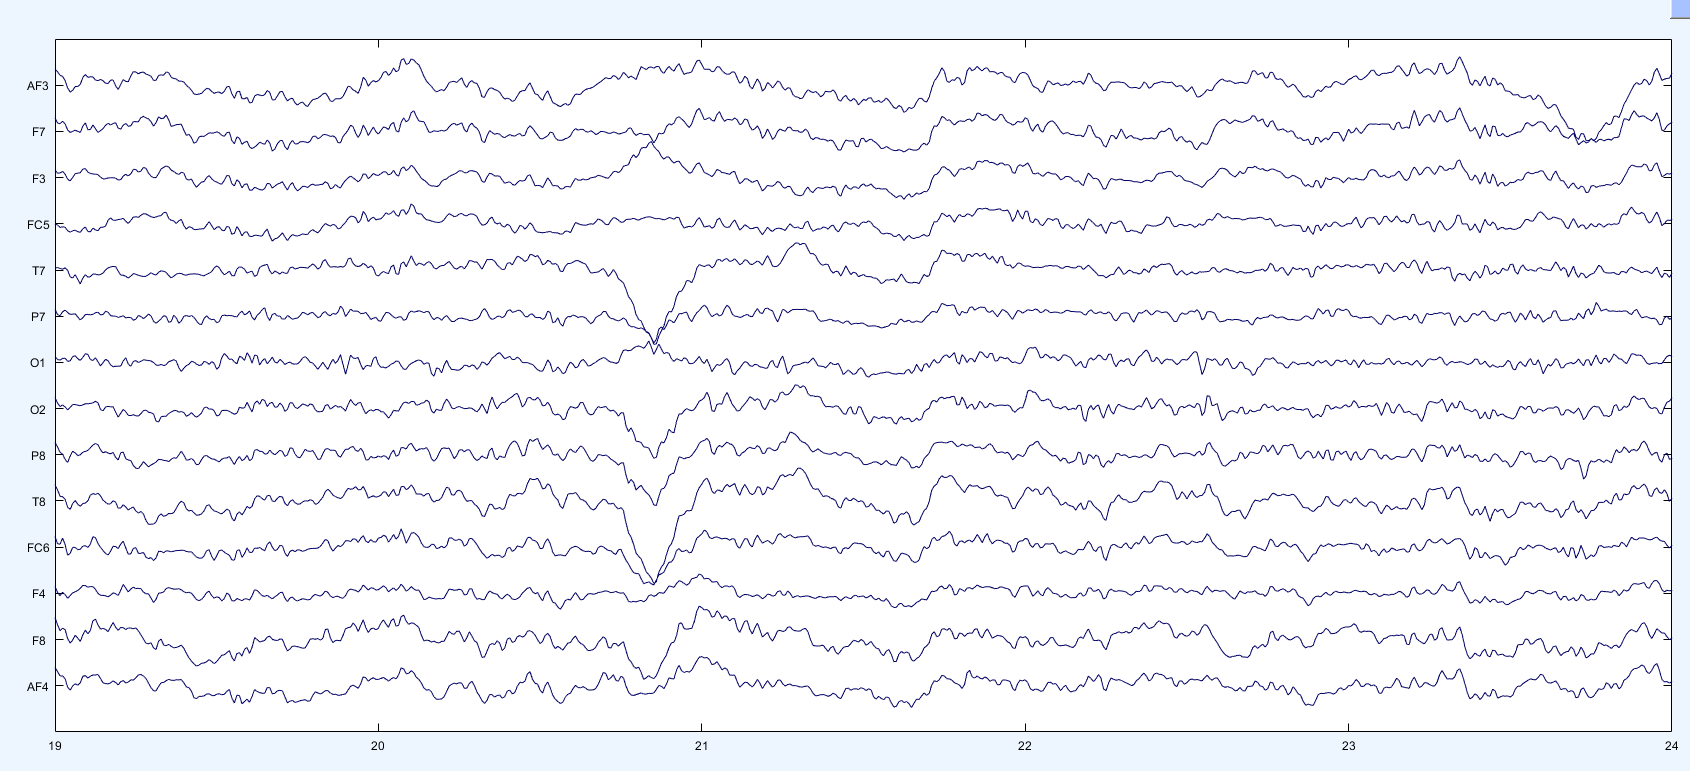
For clarity, the data we've collected looks similar to the plot below.

Noisy Data

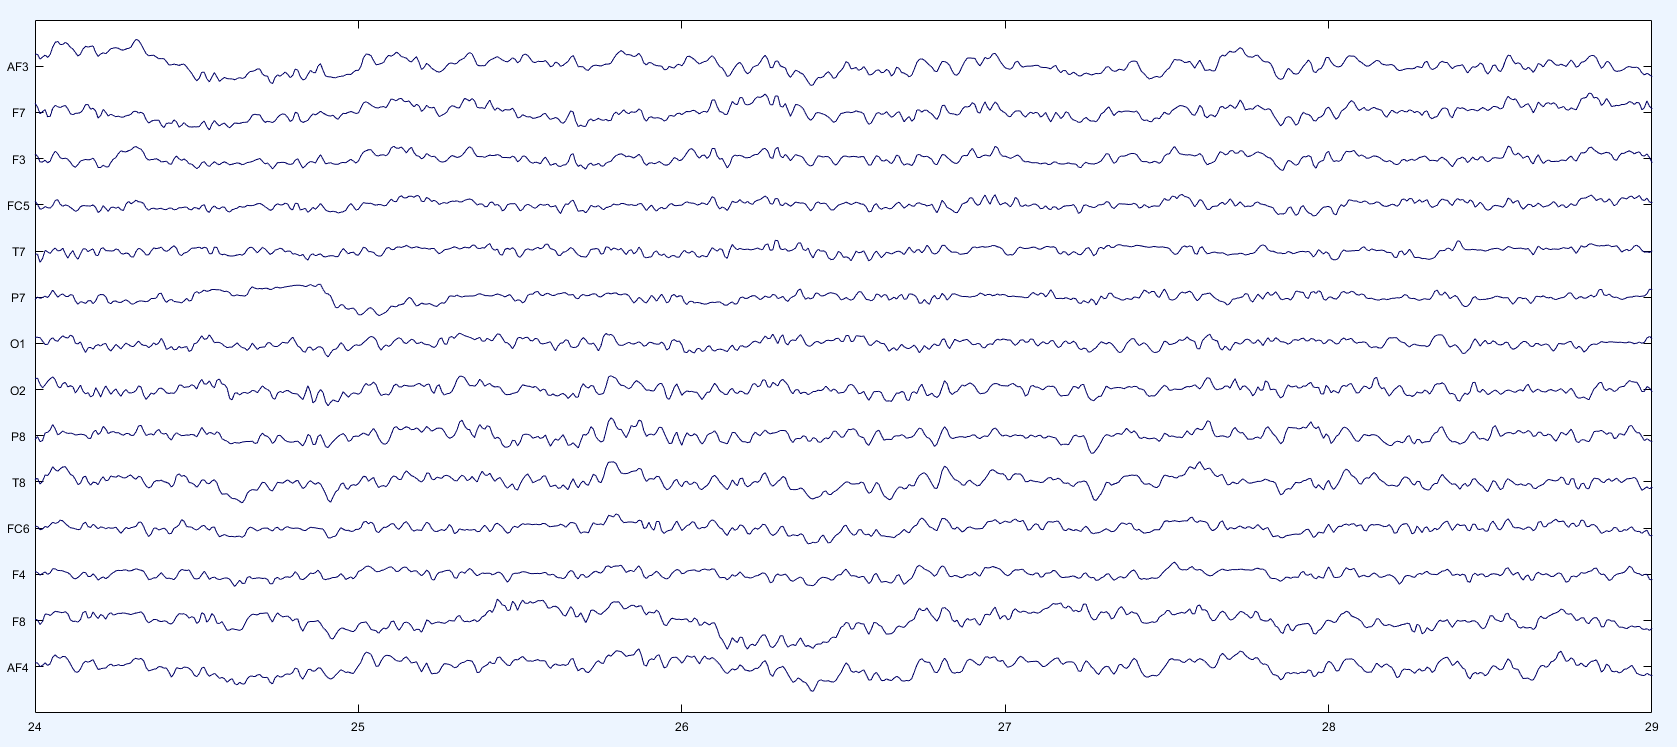
And we're looking for a minimum of 5 seconds of stable data, closer to the plot below.

Stable Data

Also, I know this data selection can be done manually using pop_eegplot, however since we have close to 300 data files I'm looking to automate this (and hopefully get more reliable selections).
$\endgroup$
4
  • $\begingroup$ Hi, welcome at CogSci. Is there a particular reason that you only want to select artifact free data periods? Or is it also okay to correct for artifacts, that is to clean your data? I bet there is a function that performs an independent component analysis (ICA) which is capable of identifying artifactual components such as blinks, muscle noise and heartbeats, and subsequently removes them. Perhaps you can tell a little more about your experiment and what you want to calculate. $\endgroup$ Commented Jul 21, 2016 at 20:25
  • $\begingroup$ Hi @RobinKramer, thanks for the welcome! I've added a bit more detail to my question in case this helps. From what I'm told, since our data collection was particularly noisy for a number of reasons, it seems that we're specifically looking to pick out stable data rather than correct it. $\endgroup$ Commented Jul 22, 2016 at 11:40
  • $\begingroup$ Another question. What are you hoping to find in these 5 seconds of data. Did you present them with particular stimuli to which you want to see the response or something, or do you want to calculate the power of the different brain waves/frequency bands? $\endgroup$ Commented Jul 26, 2016 at 11:32
  • 1
    $\begingroup$ Spot on again. I'm looking for the frequency content as responses to specific (rather lengthy) stimuli. Ultimately, I will be calculating the power of the different bands per sensor to determine which areas were activated more than others per stimulus. $\endgroup$ Commented Jul 26, 2016 at 13:05

4 Answers 4

0
$\begingroup$

You could try to use approaches that are similar to measure the strength (and delay) of a P3 response in ERP data. There are many ways described to measure the P3 responses (or any other response you are interested in) in the book of Luck: An introduction to the event related potential technique. These include:

  • Maximum value (within a time frame; sort of what you are doing)
  • Mean peak value (averaged over a time frame)
  • Area of the response ($amplitude * time$)

I am probably missing a few, so you might want to check out that book. These may provide more reliable results than solely looking at max-min differences.

$\endgroup$
1
  • $\begingroup$ Thanks for the advice Robin! Your previous answer was also extremely useful (and informative to someone like myself), however for the sake of this question I'll be choosing this as the best answer. Cheers $\endgroup$ Commented Aug 12, 2016 at 10:20
1
$\begingroup$

In this conference paper they propose an algorithm that roughly goes as follows (if you can't access it, just add "sci-hub.bz" after ".org" in the url and it redirects you directly to the pdf) :

  • Divide channels into four groups: 1) frontal, 2) central, 3) temporal and 4) parietal+occipital.
  • For each group take three signals: 1) the raw signal, 2) the alpha band(8-12Hz, using a 3rd order butterworth band-pass filter) and 3) the beta band(13-35Hz).
  • For each group and each signal calculate the four metrics: 1) max amplitude, 2) standard deviation, 3) kurtosis and 4) skewness. For the frequency band signals they also take the mean power and the standard deviation of the power.

They then go on and find optimal thresholds for each metric, group, and signal by using a differential evolution algorithm on training data, so unfortunately it's not immediately applicable for you. As I see it, you have at least two options here:

  1. Create 5 seconds long epochs of your data and label a lot of them. Use that data to learn optimal thresholds (unfortunately they don't give any details on how to do that, so you would have to figure that out yourself). This would obviously take a lot of effort but at the end you can be quite confident about your classification.
  2. Just try some value ranges for the different metrics, you can orient yourself on the values they found in the paper (you have to read them from the plots though). Check the resulting classifications. Pick the threshold values that give the "best" results by inspections. This is not as systematic as the first option but might fit your needs already. For example if you just want to avoid to have segments that were falsely classified as "clean" you might just go for very conservative/safe threshold values. There is a big danger here though, that you will get lost in an endless loop of "maybe if I adjust this threshold a bit more" and will never stop exploring. To help with that, you might also reduce the number of metrics, groups or signals.
$\endgroup$
1
  • $\begingroup$ Thanks for the tips! The paper you linked is also extremely handy to have, Cheers! $\endgroup$ Commented Aug 12, 2016 at 8:40
0
$\begingroup$

Short answer

This answer is not on how to find clean data. Instead, I would like to argue that you can clean your data.

Long answer

We collected our data in a museum environment (very noisy in many ways), with participants sitting as still as possible for 2-minute sessions at a go. For this reason, there is a high likelihood of art[i]facts being found in the data due to movement, the environment and possibly even inaccuracies from the device itself.

This is indeed true. The Emotiv Epoc has shown to not be the best EEG headset and introduces a lot of noise (e.g. Ries et al., 2014). In this study, where they used an odd-ball paradigm (a highly controlled lab experiment), the authors found that significantly more trials had to be removed, compared to medical grade EEG (BioSemi) and another wearable EEG headset (B-Alert X10).

From what I've discussed with the team, I've been told that removing artefacts wouldn't solve the issue

It is true that removing muscle artifacts (they were sitting still right?) and system noise will not be very helpful. The data will be contaminated throughout the task, and removing that would likely also remove some actual data. It may be interesting to investigate at what frequency the system adds noise. You could do a measurement with the system while it's not equipped to the head, and then calculate the frequency spectrum with an FFT. This will give you an indication of how your actual data was affected.

You can remove ocular artifacts though. As you showed in the picture, there is only one clear peak in that five second period. That particular patterns is a clear eye blink. Another EOG artifact is an eye movement, which can be seen in the picture below as the jumps in data in the top two channels (between 3 and 3.5 seconds).Both artifacts can easily and rather safely be removed due to their distinct patterns. For this I always use an independent component analysis (ICA; Makeig et al., 1996). This is also explained by Delorme and Makeig (2004) for EEGLab specifically (and here is a tutorial that explains it with FieldTrip).
enter image description here

What would that mean for your data?
Whenever you got rid of the EOG artifacts, your data should be pretty clean. Then, you do not need to search for clean periods but you can select the same (or a random) period of time for each participant. However, if you really do not want to clean your data, this answer doesn't help you.

$\endgroup$
0
$\begingroup$

For automation, you need to write a MATLAB script that controls EEGLAB. One option is to use the Automatic Artifact Removal toolbox, which you can find a link to here.

Generally, min, max, abs(max-min) criteria suffice to mark the artifactual events, followed by artifact rejection. However, line noise and environmental noise must be dealt with separately. The influence of eye movements can also be removed - either using ICA, which would be a timely process for 300 data sets (assuming you do not have have access to a MATLAB computer cluster), or computing virtual EOG channels and excluding data based on some criterion for those peaks. Compute the channel Af4-Af3 for horizontal eye movements and F7-F3 for vertical. Tweak the parameters for a single noisy data set first. If that works, batch process the files with the same criteria. I would start with Steven Luck's criteria.

Artefacts will go away once you start averaging across trials because of common mode rejection, but they can be influential if not dealt with.

$\endgroup$

Your Answer

By clicking “Post Your Answer”, you agree to our terms of service and acknowledge you have read our privacy policy.

Not the answer you're looking for? Browse other questions tagged or ask your own question.