I don't think this is a duplicate of What causes systematic under- or over-estimation of general knowledge quantities?, as the accepted (and only) answer doesn't answer this question.
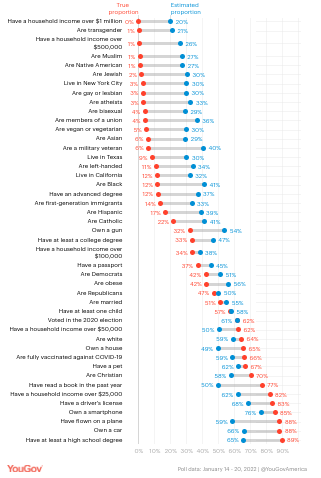
YouGovAmerica published these results, rounded to the nearest whole percent, from January 2022 to the question, "If you had to guess …":
| True | Estimate | What percentage of American adults? |
|---|---|---|
| 0% | 20% | Have a household income over \$1 million |
| 1% | 21% | Are transgender |
| 1% | 26% | Have a household income over \$500,000 |
| 1% | 27% | Are Muslim |
| 1% | 27% | Are Native American |
| 2% | 30% | Are Jewish |
| 3% | 30% | Live in New York City |
| 3% | 30% | Are gay or lesbian |
| 3% | 33% | Are atheists |
| 4% | 29% | Are bisexual |
| 4% | 36% | Are members of a union |
| 5% | 30% | Are vegan or vegetarian |
| 6% | 29% | Are Asian |
| 6% | 40% | Are a military veteran |
| 9% | 30% | Live in Texas |
| 11% | 34% | Are left-handed |
| 12% | 32% | Live in California |
| 12% | 41% | Are Black |
| 12% | 37% | Have an advanced degree |
| 14% | 33% | Are first-generation immigrants |
| 17% | 39% | Are Hispanic |
| 22% | 41% | Are Catholic |
| 32% | 54% | Own a gun |
| 33% | 47% | Have at least a college degree |
| 34% | 38% | Have a household income over \$100,000 |
| 37% | 45% | Have a passport |
| 42% | 51% | Are Democrats |
| 42% | 56% | Are obese |
| 47% | 50% | Are Republicans |
| 51% | 55% | Are married |
| 57% | 58% | Have at least one child |
| 62% | 61% | Voted in the 2020 election |
| 62% | 50% | Have a household income over \$50,000 |
| 64% | 59% | Are white |
| 65% | 49% | Own a house |
| 66% | 59% | Are fully vaccinated against COVID-19 |
| 67% | 62% | Have a pet |
| 70% | 58% | Are Christian |
| 77% | 50% | Have read a book in the past year |
| 82% | 62% | Have a household income over $25,000 |
| 83% | 68% | Have a driver's license |
| 85% | 76% | Own a smartphone |
| 88% | 59% | Have flown on a plane |
| 88% | 66% | Own a car |
| 89% | 65% | Have at least a high school degree |
Without exception, the small true answers were over-estimated, and the larger true answers were under-estimated, as can be seen by the blue line (estimates) being much more centralized and vertical than the red line (true values) in their graph:
What causes people to over-estimate small proportions and under-estimate large proportions?
It can't simply be the result of bias created by the media, as this moderation happens even when the results are blatantly impossible: the estimates based on non-overlapping racial categories add up to 225%.
Note that I'm not asking about anything related to the individual topics themselves, only about this observed moderating effect.
