0
$\begingroup$

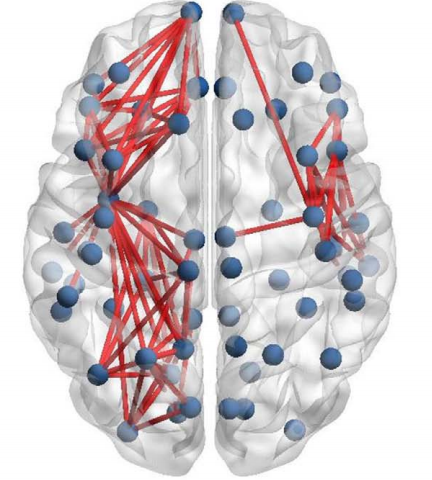
I am following a paper to calculate functional connectivity of difference between MDD (major depressive disorder group) and Control group. I am getting more connectivity in MDD as compared to control group in certain frequency bands. The paper after calculating binary matrix and plotting it in 3D is getting region specific connections (like it is noticeable that left central, left parietal-occipital regions etc. is having more connections) and proceeding it further by narrowing down interests on these specific regions.

enter image description here

I am stuck at this level, as I'm not getting region specific connectivity infact I'm getting inter-hemisphere connections. Please guide how to continue this further.

I'm using mne (Python) to code.

Algorithm:

  1. I've calculated phase synchronization between two signals using PLI for both groups and created adjacency matrices for both. Then I've converted both adjacency matrix to binary matrix using a threshold. (Manually setting threshold to higher value for clearer graph)
  2. Then calculating difference matrix between both binarized matrices using absolute(difference)
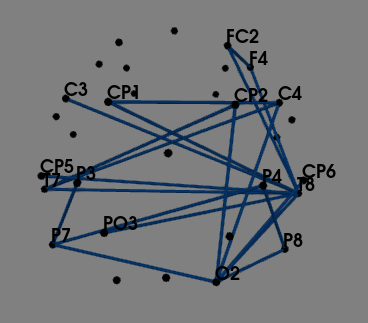
  3. Finally, Plotting that difference matrix using plot_sensors_connectivity() function

My plot: enter image description here

Ideally, should the difference matrix absolute(MDD-control) be region specific like in paper or have inter-hemisphere connections as well? If region-specific, what might be reason for my plot connectivity?

Note: This is plotted using a resting state eye open EEG data (32 channels). And both these graphs are for a specific frequency band.
$\endgroup$
7
  • 1
    $\begingroup$ Just because someone finds some relationship in a paper does not mean every data set will show the same relationship, especially if either has a small sample size. Are you calculating some sort of "statistical significance" for connections and if so are you correcting that test for multiple comparisons? $\endgroup$
    – Bryan Krause
    Commented Dec 18, 2023 at 14:47
  • $\begingroup$ I would typically not suggest thresholding for anything but display purposes, and if so doing that threshold step at the very last moment. Also these are quite sophisticated analyses so I would not recommend doing it without guidance of someone familiar with these techniques. Unfortunately there are a lot of papers out there published by fairly clueless researchers using convenient software packages that make it a bit too easy to make a pretty picture. $\endgroup$
    – Bryan Krause
    Commented Dec 18, 2023 at 14:48
  • $\begingroup$ Hi @BryanKrause, thanks for the guidance. The goal of this study is to find potential biomarkers for depression. The steps in the beginning are about narrowing down our observations. So, with this step we are finding strong connections (obtained via thresholding our PLI matrices for both MDD vs healthy group's brains) and calculating difference between both. This according to paper, is giving them specific regions in brain where activity is different in MDD group and control group. $\endgroup$ Commented Dec 19, 2023 at 10:47
  • $\begingroup$ Correlation tests would be later used after narrowing down our observations. And the sample size as of now is multiple for MDD group and unfortunately, limited to only 2 for control group. So, as you can infer I'm unable to proceed from the narrowing down of regions of interest part. Could you guide me further and offer more observations regarding this? $\endgroup$ Commented Dec 19, 2023 at 10:54
  • $\begingroup$ You simply don't have enough data for your goals, I'm sorry. There is no fix for that. Your thresholding procedure is probably emphasizing noise in your data. If you aren't doing any statistical testing at this point you can't differentiate the signals you think you found from noise. Most likely it's all noise. $\endgroup$
    – Bryan Krause
    Commented Dec 19, 2023 at 13:07

0

Your Answer

By clicking “Post Your Answer”, you agree to our terms of service and acknowledge you have read our privacy policy.